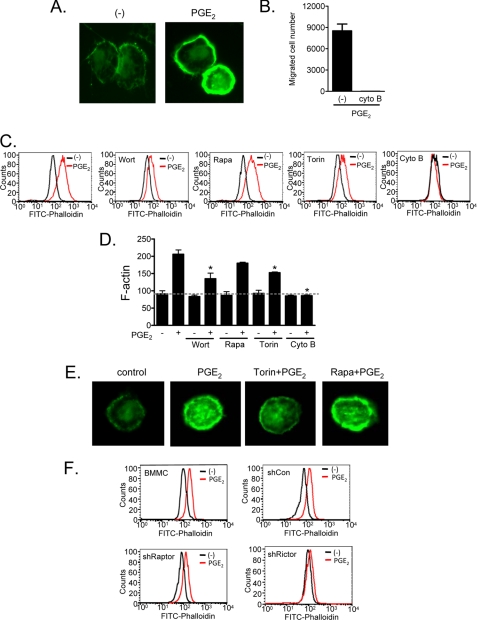
FIGURE 4.
mTORC2 regulates PGE2-induced actin polymerization. A, cells were stimulated with PGE2 (100 nm) for 2 min then fixed and permeabilized. Actin polymerization was performed using FITC-labeled phalloidin (2 μg/ml) staining of the cells, followed by imaging by fluorescence microscopy. B, cytokine-deprived BMMCs were preincubated with the actin polymerization inhibitor cytochalasin B (10 μm) for 30 min, and then the chemotaxis assay was performed. C, BMMCs were preincubated with the indicated inhibitors (wortmannin (Wort, 100 nm, 30 min), rapamycin (Rapa, 100 nm, 30 min), Torin (100 nm, 30 min), or cytochalasin B (Cyto B, 10 μm, 30 min)), then stimulated with PGE2 (100 nm) for 2 min, fixed, and permeablized. Actin polymerization was assessed using FITC-labeled phalloidin (2 μg/ml) staining of the cells, followed by flow cytometry. D, mean values from data in C. E, BMMCs were preincubated with Torin or rapamycin for 15 min, then stimulated with PGE2 for 2 min, fixed, and permeabilized. Actin polymerization visualization was performed using FITC-labeled phalloidin (2 μg/ml) staining of the cells, followed by imaging with fluorescence microscope. F, shRNA-transduced BMMCs were stimulated with PGE2 (100 nm) for 2 min and then fixed and permeabilized. Actin polymerization was measured by flow cytometry. The results are the means ± S.E. of three separate experiments. *, p < 0.05 for comparison with PGE2 alone stimulation by Student's t test. The data in A, C, E, and F are representative from three separate experiments.

