FIGURE 1.
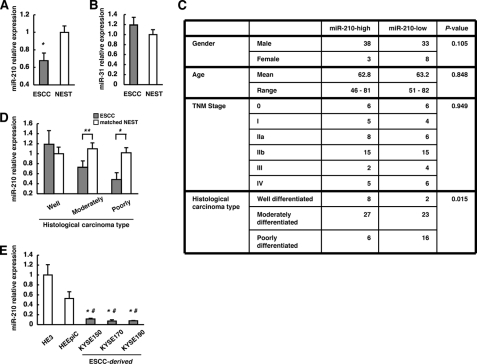
Down-regulation of miR-210 expression in ESCC. A and B, expression levels of miR-210 and miR-31 in NEST and ESCC assessed by qRT-PCR. The values are shown relative to the value obtained for NEST (n = 82; *, p < 0.01). C, clinicopathologic characteristics of 82 ESCCs divided into two groups (n = 41) on the basis of miR-210 expression levels. D, expression levels of miR-210 in the ESCCs and the corresponding NESTs in each histological type were compared by qRT-PCR. The values are shown relative to the value obtained for NEST in the well differentiated group (**, p < 0.05; *, p < 0.01). E, levels of miR-210 in HE3, HEEpiC, and KYSE cell lines analyzed by qRT-PCR. The values are shown relative to the value obtained for HE3 (n = 3; *, p < 0.05 versus HE3; #, p < 0.05 versus HEEpiC). Error bars, S.E.

