FIGURE 4.
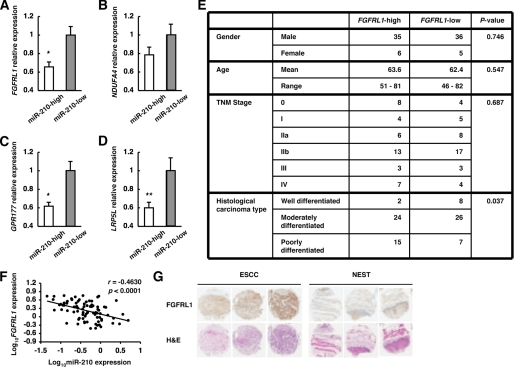
Identification of candidate target genes of miR-210 in ESCC. A–D, FGFRL1, NDUFA4, GPR177, and LRP5L expression levels in ESCCs divided into two groups on the basis of miR-210 expression levels were assessed by qRT-PCR. The values are shown relative to the value obtained for the miR-210-low group (n = 41; **, p < 0.05; *, p < 0.01). E, clinicopathologic characteristics of 82 ESCCs divided into two groups (n = 41) on the basis of FGFRL1 expression levels. F, plot of log10FGFRL1 relative expression intensity against log10miR-210 relative expression intensity. The line represents an approximated curve. The correlation coefficient (r) and the p value indicate the statistical significance of the negative correlation between the x and y variables. G, immunohistochemistry for FGFRL1 on ESCC and NEST. These sections were stained by anti-FGFRL1 antibody and by hematoxylin and eosin (H&E).

