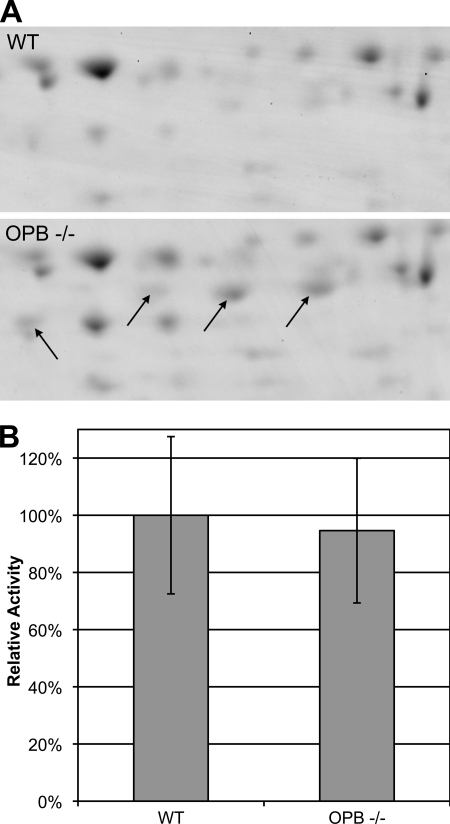
FIGURE 6.
Proteomic analysis of OPB knock-out parasites. A, two-dimensional gel electrophoresis was used to compare lysates from wild type and OPB double knock-out parasites. The arrows indicate four spots that were significantly more intense in lysate from the knock-out parasites. The intensity increase was observed on replicate gels. The proteins in these spots were identified by mass spectrometry and were all found to be enolase. B, to confirm that the accumulated isoforms of enolase found in the OPB knock-out parasites did not represent increased glycolytic enolase, the glycolytic pathway function of enolase was analyzed by measuring the conversion of 2-phosphoglycerate to phosphoenolpyruvate spectrophotometrically. Error bars, S.D. of three separate experiments.

