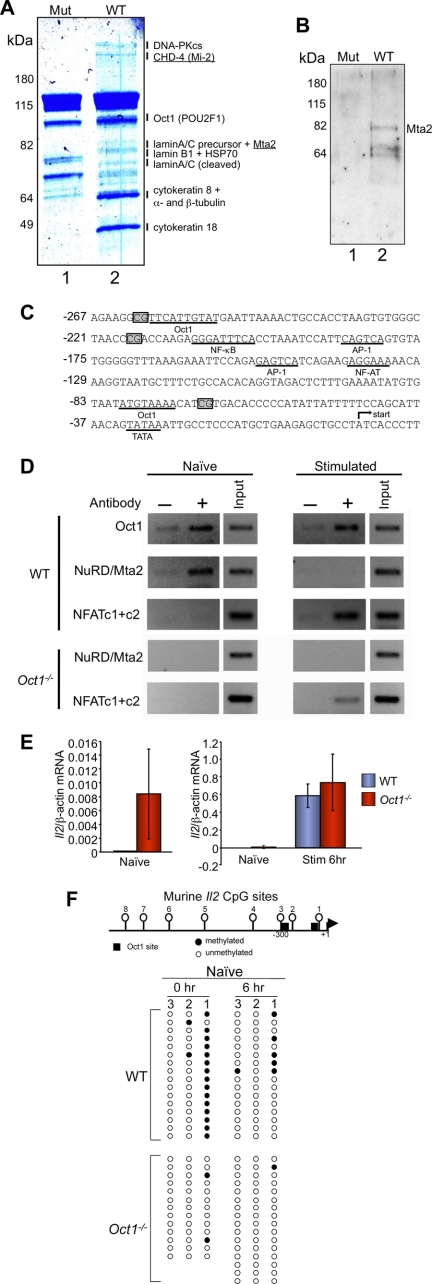
FIGURE 2.
Oct1 mediates Il2 repression in naïve T lymphocytes. A, Coomassie Blue-stained 10% polyacrylamide gel showing proteins from HeLa cell nuclear extracts retained on latex nanoparticles coated with human Il2 promoter DNA containing an Oct1 binding site (−262 to −222, lane 2), or an mutant octamer control (lane 1). Indicated bands showing differential retention were excised and subjected to liquid chromatography-mass spectrometry (LC/MS). Annotated bands had MASCOT scores >20 and mass errors <3 ppm. B, Western blot using Mta2 antibodies of a similar nanoparticle purification using nuclear extracts from EL-4 T cells. C, sequence of the murine Il2 proximal promoter region. CpG positions are boxed. Known transcription factor binding sites and TATA box are underlined. The transcription start site is depicted with an arrow. D, ChIP assays performed using primary splenic naïve T cells and two combined Oct1 antibodies, an antibody against the NuRD subunit Mta2, or combined antibodies against NFAT c1+c2. Amplification products using a region of the Il2 promoter encompassing Oct1 binding sites are shown. E, qRT-PCR analysis of Il2 mRNA expression levels in naïve and stimulated CD4+ splenic T cells. Error bars depict S.D. Panel on right is the averaged result of three experimental replicates. Isolated naïve cell data in left panel include six additional replicates. F, bisulfite sequencing analysis of the murine Il2 proximal promoter region. A schematic is shown at the top. Oct1 sites are shown with boxes. CpG methylation sites are numbered. Data from sequencing of clones are depicted below. Filled circles indicate the presence of a methylation event for a given clone.

