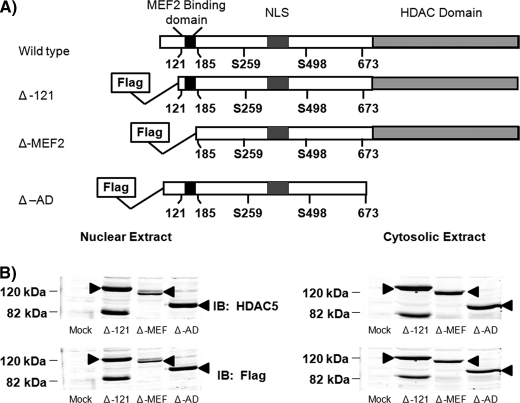
FIGURE 1.
Expression and compartmental distribution of HDAC5 mutants in COS7 cells and 3T3-L1 adipocytes. A, schematic representation of HDAC5 wild type and FLAG-tagged truncated mutants used. B, 50 μg of nuclear or cytosolic extracts from COS-7 cells transiently overexpressing empty vector (Mock) or truncated FLAG-tagged HDAC5 were analyzed by SDS-PAGE and immunoblotted (IB) with FLAG or HDAC5 antibodies. The arrow indicates HDAC5.

