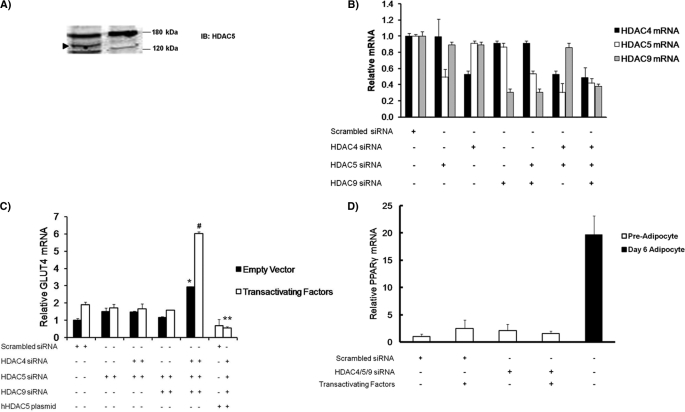
FIGURE 6.
siRNA-mediated knockdown of class II HDACs increase endogenous GLUT4 mRNA in preadipocytes with and without transactivating factors. A, nuclear extracts of 3T3-L1 preadipocytes transiently transfected with scrambled siRNA or HDAC5 siRNA and analyzed by SDS-PAGE and immunoblotting for endogenous HDAC5. The arrow indicates the HDAC5 band. IB, immunoblot. B, preadipocytes were transiently transfected with either scramble siRNA or the indicated specific HDAC siRNA in combination. RNA was isolated and subjected to quantitative PCR to determine the relative effectiveness of knocking down HDAC4, HDAC5, and HDAC9. C, preadipocytes were transiently transfected with either scrambled siRNA or HDAC-specific siRNA as indicated by +. The cells were then incubated for 3 days and then transiently transfected again with either pcDNA3 (empty vector) or transactivator plasmids (MEF2A, GEF, and LXRα). RNA was isolated and analyzed by RT-PCR for endogenous GLUT4 mRNA. The data are from at least three independent experiments. The data are expressed as the means ± S.E. and analyzed by one-way analysis of co-variance. The asterisk indicates a statistically significant difference (p < 0.05) without transactivating factors. The number sign indicates a statistically significant difference from knocking down all three class II HDACs and the addition of transactivating factors (p < 0.05) over all other conditions. D, preadipocytes or adipocytes 6 days after differentiation were transiently transfected with either scrambled siRNA or HDAC-specific siRNA as indicated by +. The cells were then incubated for 3 days and then transiently transfected again with either pcDNA3 (empty vector) or transactivator plasmids (MEF2A, GEF, and LXRα). RNA was isolated and analyzed by RT-PCR for endogenous PPARγ mRNA. The data are from at least three independent experiments. The data are expressed as the means ± S.E. and analyzed by one-way analysis of co-variance. The asterisk indicates a statistically significant increase in differentiated adipocyte PPARγ compared with all other conditions (p < 0.001).

