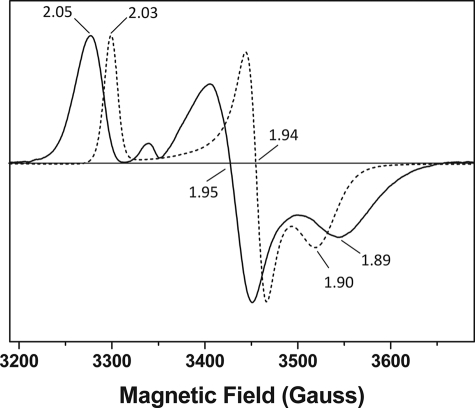
FIGURE 5.
EPR spectroscopy demonstrates distinctive [2Fe-2S] cluster organization in Fd2 and FdC1. Electron paramagnetic resonance (EPR) spectra of dithionite-reduced Fd2 (solid line) and FdC1 (dashed line) showing 2Fe-2S g values of gz = 2.05, gy = 1.95, gx = 1.89, and gz = 2.03, gy = 1.94, gx = 1.90, respectively. No significant radical signals were observed for the oxidized proteins (not shown). The samples were run under identical conditions (as described under “Experimental Procedures”) at 15 K.

