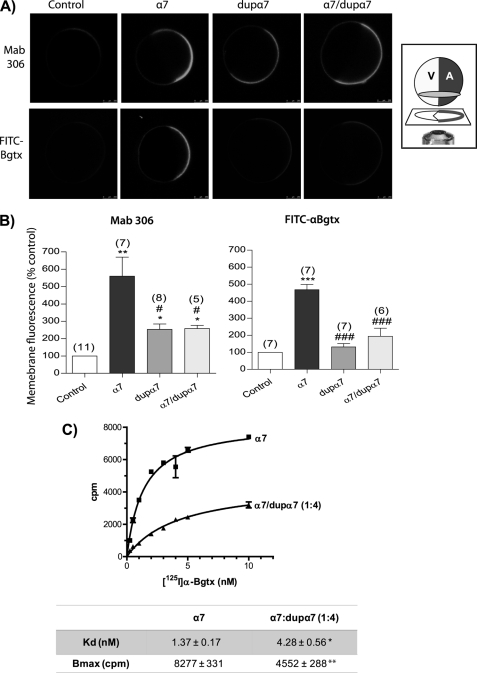
FIGURE 4.
dupα7 reduces the number of functional α7 nAChRs expressed on the oocyte surface. A, representative confocal images of eight intact oocytes labeled with Mab306 antibody (top row) or FITC-αBgtx (bottom row). Oocytes were injected with α7 (20 ng), dupα7 (20 ng), or with the combination (1:1) of α7/dupα7 mRNAs; on the left are two control noninjected oocytes. Inset, oocyte orientation on the confocal microscope stage; V and A indicate the vegetal and animal hemisphere, respectively. B, histograms show pooled results of fluorescent intensity determined in an ROI located on the animal surface of the oocyte; data were normalized in respect to control. Each bar shows the mean ± S.E. of the number of oocytes in parentheses. The data were analyzed by ANOVA; *, p ≤ 0.05; **, p ≤ 0.01 ; ***, p ≤ 0.001 upon comparing injected with control oocytes. #, p ≤ 0.05, and ###, p ≤ 0.001 after comparing oocytes injected with dupα7 or α7/dupα7 mRNAs versus α7-mRNA-injected oocytes. C, saturation curves showing specific binding of 125I-α Bgtx to the surface of intact oocytes injected with α7 mRNA (20 ng) or with the combination α7/dupα7 (20:80 ng). The adjustment of the curves and the determination of Kd and Bmax values were done with GraphPad Prism5 software. The analysis of the variation in Kd and Bmax values between the two groups of oocytes was performed with the Mann Whitney test for analysis of two nonparametric variables, *, p ≤ 0.05; **, p ≤ 0.01. A total of 6–8 oocytes from two different donors were used for each value plotted in the curves.

