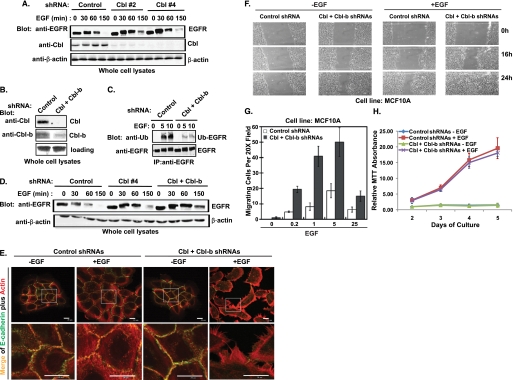
FIGURE 2.
Knockdown of Cbl and Cbl-b in MECs decreases the EGF-induced EGFR ubiquitinylation and degradation, enhances the disruption of AJs and cell migration, but does not affect cell proliferation. A, MCF10A cells with stable expression of control shRNA, Cbl shRNA#2, and Cbl shRNA#4 were growth factor-starved for 3 days before stimulation with EGF (100 ng/ml) for the indicated time points. Whole cell lysates were immunoblotted for EGFR, Cbl, and β-actin. B, whole cell lysates of MCF10A cells with stable overexpression of control shRNAs or Cbl/Cbl-b shRNAs were immunoblotted for Cbl and Cbl-b. C, MCF10A cells with stable expression of control shRNAs or Cbl/Cbl-b shRNAs were growth factor-starved and stimulated with EGF (100 ng/ml) for the indicated time points. Cell lysates were subjected to IP with anti-an EGFR antibody and immunoblotted for ubiquitin (upper panel, Ub-EGFR) and EGFR (lower panel). D, MCF10A cells with control shRNA, Cbl shRNA (#4), or Cbl/Cbl-b shRNA expression were growth factor-starved for 3 days and stimulated with EGF (100 ng/ml) for the indicated time points. Whole cell lysates were immunoblotted for EGFR. E, MCF10A cells with control shRNA or Cbl/Cbl-b shRNA expression were growth factor-starved and then stimulated with EGF (3 ng/ml) for 12 h. The cells were immunostained with anti-E-cadherin antibodies (green) and phalloidin (red). Both the whole cell colony image and the high resolution image of the indicated areas in the colonies were acquired by confocal microscopy scanning at the subapical plane (scale bar, 20 μm). F, wound healing assay. MCF10A cells were grown to confluence and growth factor-starved for 72 h; a scratch wound was made with a micropipette tip (blue tip) and the edge of cells was marked. EGF (10 ng/ml) was then added to the starvation media, and cells were allowed to migrate toward the center of the wound and photographed at the indicated times (representative figure of three independent experiments). G, trans-well migration assay. Cells were growth factor-starved for 72 h, harvested, plated in the top chamber of trans-well plates (1 × 10⁴ per chamber in triplicate) on a fibronectin-coated surface with 8-μm pores, and allowed to attach for 4 h. EGF at the indicated concentrations (ng/ml) was added to starvation media in the bottom well, and cells that migrated to the bottom side of the filter in 16 h were scored. Mean values are presented with standard deviation indicated. H, MCF10A cells with control shRNA or Cbl/Cbl-b shRNA expression were grown in 96-well plates (2 × 10³/well) in octuplicates in DFCI media with or with EGF. MTT assay was done at the indicated days, and the average MTT absorbance values in each cell line were normalized to the non-EGF-treated cells harvested at day 2 and presented as a graph with standard deviation indicated (representative figure of three independent experiments). There is no statistically significant difference (p = 0.34) between the two groups.

