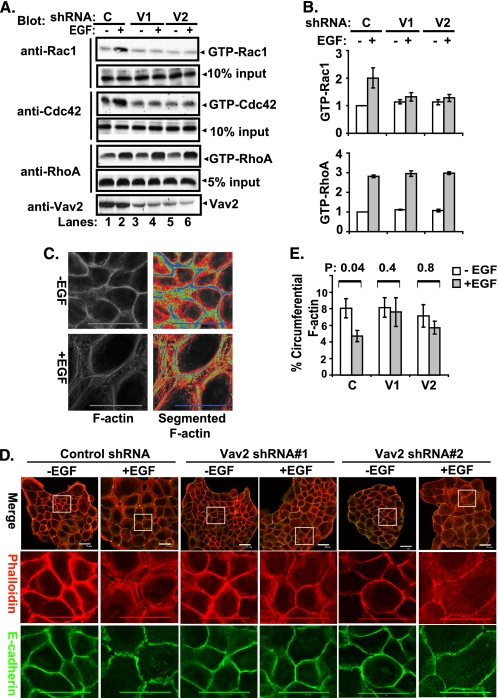
FIGURE 4.
EGF-induced reorganization of junctional actin cytoskeleton through activation of Vav2-Rac1/Cdc42. A, control shRNA- (C, lanes 1 and 2), Vav2 shRNA#1- (V1, lanes 3 and 4), and Vav2 shRNA#2 (V2, lanes 5 and 6)-expressing cells were growth factor-starved for 72 h and stimulated with EGF (100 ng/ml) for 10 min. The whole cell lysates were subjected to GST-PBD or GST-RBD pulldown and immunoblotted for Rac1, Cdc42, or RhoA as indicated. The whole cell lysate input for pulldown was used as loading control and also blotted for Vav2 (lowest panel) (representative figure of three independent experiments). B, average relative density of GTP-bound forms of the Rac1 and RhoA from three experiments is presented as bars with standard deviation. C, quantification of junctional actin cytoskeleton reorganization. 3 × 10³ cells were grown on 20 × 20-mm glass coverslips in DFCI-1 media without EGF for 4 days until the cells formed discrete colonies; the cells were then stimulated with EGF (3 ng/ml) for 12 h before fixation. The cells were permeabilized with 0.5% Triton X-100, stained with Alexa Fluor 594-conjugated phalloidin, and scanned under a confocal microscope at the subapical plane to acquire the junctional F-actin images. To quantify the distribution and reorganization of junctional F-actin, the segmented histogram (Metamorph software) was used to subgroup the F-actin staining according to the fluorescence intensity. Two typical cell images were used as the gold standard to configure the segmentation criteria in terms of fluorescence intensity (FI), which subgroups the junctional F-actin into circumferential (blue, FI = 255–161), peri-junctional (green, FI = 160–101), diffuse (red, FI = 100–61), and background (black, FI = 61–0). The Bin areas of each group were acquired, and the total Bin areas excluding background were used as total F-actin area, and the percentage Bin area of the circumferential F-actin versus the total F-actin was calculated and graphed. D, 16A5 cells with stable expression of control shRNA or Vav2 shRNAs were growth factor-starved for 4 days and stimulated with EGF (3 ng/ml) for 12 h. The cells were immunostained for E-cadherin (green) and F-actin (red) and were scanned with confocal microscopy at the subapical plane to acquire images of the whole cell colonies or of the indicated areas. E, cells with or without EGF stimulation (3 ng/ml for 12 h) were analyzed by F-actin segmentation. The mean percentage of circumferential F-actin in each experimental group was calculated from randomly selected colonies (n = 19) and the mean percentages were compared by one-way analysis of variance and then by paired t test following a logarithmic transformation. The mean percentages of the circumferential F-actin are presented with standard errors as Y-error bars, and the p values are indicated above the paired bars.

