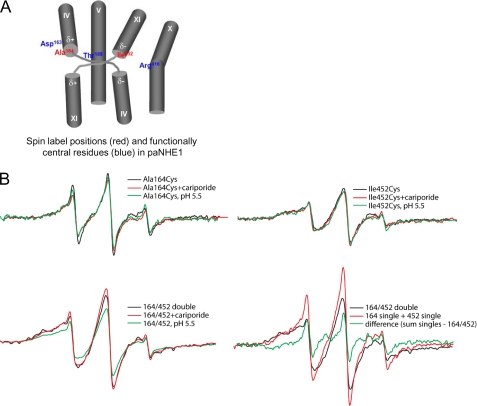
FIGURE 7.
EPR analyses of paNHE1 A164C, I452C, and A164C/I452C. The spectra were collected from samples of purified paNHE1 in PBS buffer (pH 7.5) containing 0.01% DDM, and the protein concentration (normalized to 20 μm spin for singles, 40 μm for double and sum of singles) is normalized to the same value for all samples. A, spin label positions (red) and functionally central residues (blue) in paNHE1. See text for details. B, top panels, effects of cariporide (1 mm) and low pH (5.1) on the EPR spectra of samples containing a spin label at position A164C or I452C, respectively. Bottom panels, effects of cariporide (1 mm) and low pH (5.1) on the EPR spectra of double labeled A164C/I452C samples and the signal from the double labeled sample compared with the sum of singles. The residual signal was subtracted from all spectra. Each spectrum shows a scan over a field of 100 G.

