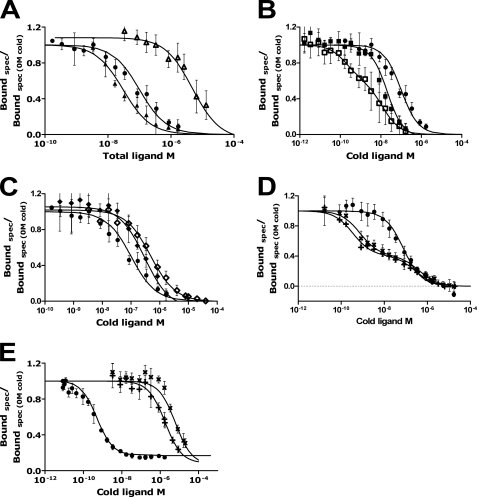
FIGURE 4.
Competition for insulin receptor. All curves are plotted as specific (spec) binding/specific binding at 0 m cold ligand as a function of the concentration of unlabeled ligand at pH 7.6. Competition of 125I human insulin with increasing concentrations of human insulin (●) for DIR on S2 cells is illustrated in all panels. The competition of human insulin at pH 6.5 (○) is compared with pH 7.6 (●). Binding curves show the competing effect of IGF-I (△), IGF-II (▴), X92 (□), H2 (■), DOP (♢), X92DOP (♦), C4 (×), and DB (+). Competition of 125I human insulin with increasing concentrations of human insulin (●), C4 (×), and DB (+) for human insulin receptor on IM9 cells is illustrated in panel E. The curves are the averages of at least three assays each made in duplicates.

