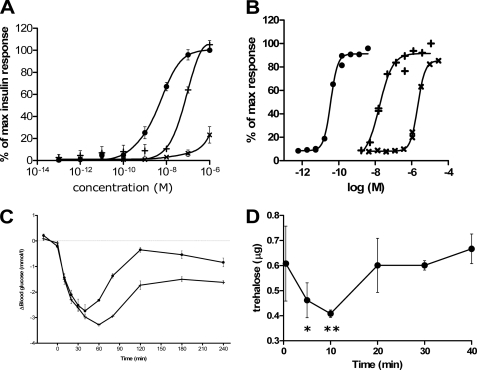
FIGURE 6.
Functional studies of DILP5. Mitogenic potency is illustrated by [3H]thymidine incorporation of L6 rat muscle myoblasts stably transfected with IR-A (A). L6 rat muscle myoblast were treated with increasing concentrations of human insulin (●), C4 (×), and DB (+). The results are illustrated as percent of the insulin response at the highest concentration (10−6 m) for each assay. Curves are the average of at least three assays, each made in duplicate, and are fitted using a sigmoidal dose-response curve fit with variable slope. Panel B depicts glucose uptake in primary rat adipocytes as a function of increasing concentrations of ligand. [3-3H]Glucose uptake was measured by incubating freshly isolated rat adipocytes with increasing concentrations of human insulin (●), C4 (×), and DB (+). Curves are representative of three assays, each made in duplicate. Panel C shows intravenous administration of human insulin and DB in serum-starved Sprague-Dawley rats. The rats were anesthetized before intravenous injection of the ligands. Injection of human insulin 2.5 nmol/kg (●) and DB 500 nmol/kg (+) was performed at time point 0, and 10-μl blood samples were collected from the tail tip 10 time points in addition to a time point before injection. Panel D shows the effect of injection of DB on trehalose level in Drosophila, Five-day-old female flies were injected with 0.01 mg/ml DB. The mean and S.D. are plotted from samples collected before injection (0 min) and at 5, 10, 20, 30, and 40 min. Trehalose is per 2.5 μl of sample homogenate. p < 0.05 (*) and p < 0.01 (**) compared with 0 min (one-way analysis of variance with Dunnett's post-test).

