FIGURE 2.
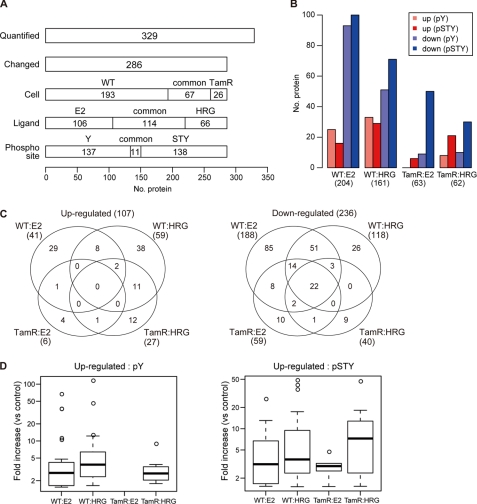
Ligand-induced phosphorylation in WT and TamR MCF-7 cells. A, the number of proteins quantified by SILAC and their composition are shown. Cell-, ligand-, and phosphorylation residue-specific proteins are depicted in the third, fourth, and fifth panels, respectively. Y and STY indicate tyrosine and serine/threonine/tyrosine. B, the number of up- and down-regulated proteins in ligand-stimulated WT and TamR cells. Up-regulation (shown in red) and down-regulation (shown in blue) were defined as an increase or decrease, respectively, equal to or greater than 1.5-fold compared with unstimulated cells. C, cell- and ligand-specific up (shown at left) and down (right) phosphorylation. Note that one up-regulated protein was commonly observed in E2-stimulated WT, and HRG-stimulated TamR are not included in the Venn diagram. Three down-regulated phosphorylation proteins commonly found in E2-WT and HRG-TamR cells and two down-regulated proteins in HRG-WT and E2-TamR cells were also not shown. D, distribution of fold changes of up-regulation. Fold increase in tyrosine and serine/threonine/tyrosine phosphorylation (pY and pSTY, respectively) are plotted in the left and right panels, respectively. No up-regulated phosphorylation on tyrosine residues was observed in E2-stimulated TamR cells.

