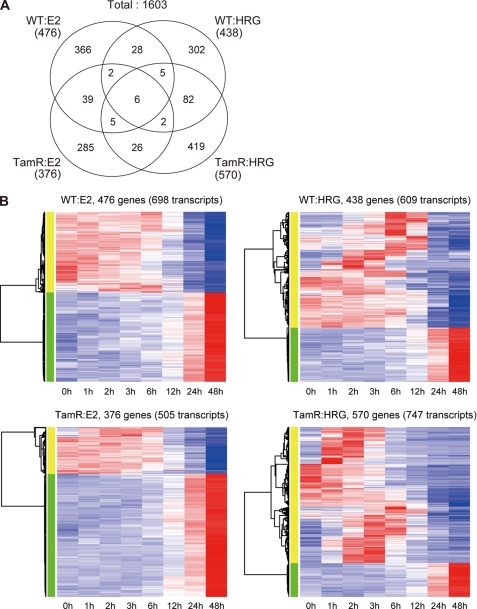
FIGURE 4.
Ligand-induced transcription in WT and TamR MCF-7 cells. A, the number of ligand-responsive genes in WT and TamR. The numbers of ligand- and cell-specific and common genes are shown in the Venn diagram. Note that 11 genes were observed in HRG-induced WT and E2-induced TamR cells, and 25 genes were common for E2-WT and HRG-TamR cells are not included in the Venn diagram. B, ligand-responsive gene expression profiles in WT and TamR cells. Hierarchical clustering was applied to the gene expression time courses, and the results are visualized as a heat map. The rows and columns represent transcript and ligand stimulation time (hours), respectively. Red and blue in the heat map indicate high and low expression levels, respectively.

