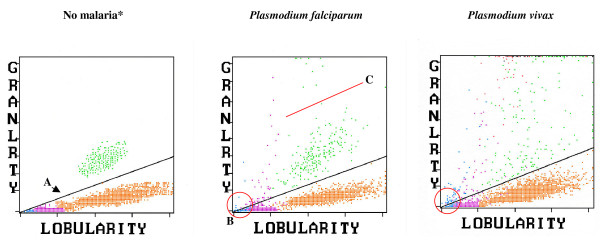
Figure 1.
Cell-Dyn 3700 side-scatter/depolarized side-scatter plot of samples with no malaria, P. falciparum and P. vivax malaria. A. The diagonal line gives optimal separation between eosinophils (green) and neutrophils (orange). In the P. falciparum sample (middle panel) purple dots indicate depolarizing monocytes. At the top of the scatter-plot are haemozoin-containing neutrophils misclassified as eosinophils. Blue-coded depolarizing events might possibly be small haemozoin-containing monocytes. In the P. vivax sample (right panel), the changes are more pronounced, and additionally haemozoin-containing RBC (red) appear to be present. B. As the diagonal line reaches the 0/0 point (red circle), small increases in depolarization may cause monocyte/lymphocyte events to easily surpass this line and be classified as depolarizing (false positives). C. In the middle panel it is easy to distinguish two green-coded populations below (eosinophils) and above the red line (haemozoin-containing neutrophils), which is not always the case (see P. vivax sample). * Colour code for events displayed is, blue: lymphocytes; purple: monocytes; orange: neutrophils; green: eosinophils; red: erythrocytes; black: not classified.

