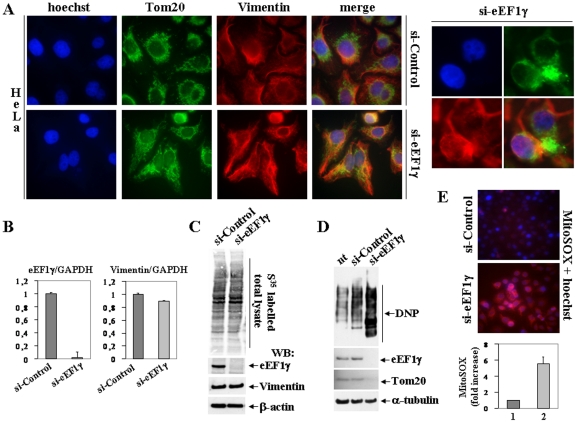
Figure 5. Analysis of eEF1γ depletion.
A: Indirect immunofluorescence obtained with the anti-Tom20 rabbit polyclonal and the anti-Vimentin monoclonal antibody in HeLa cells treated with siRNA-Control or with siRNA-eEF1γ. On the right side a higher magnification image of eEF1γ-depleted HeLa cells focusing on the formation of mitochondrial dysfunctional clusters. B: Real time RT-PCR analysis of the eEF1γ (left) and Vimentin (right) mRNAs in HeLa cells (siRNA-Control and siRNA-eEF1γ). The gene expression ratio between eEF1γ and GAPDH and between Vimentin and GAPDH are shown as means ± SD from three independent experiments performed in triplicate. C: The global protein synthesis of HeLa cells, transfected with either siRNA-Control or siRNA-eEF1γ and supplemented with S35 labelled methionin and cystein, was visualized by autoradiography of the total protein lysates blotted to nitrocellulose membrane. Then the same membrane was incubated with the anti-eEF1γ rabbit polyclonal and the anti-Vimentin mouse monoclonal antibodies. Anti-β-actin monoclonal antibody was used to normalise the amount of protein loaded on the gel. D: Induced carbonylation pattern (oxidation level) of HeLa cells: untreated, treated with either siRNA-Control or siRNA-eEF1γ. The total protein carbonylation pattern was visualised by western blot with the anti-DNP antibody. Depletion of eEF1γ by siRNA was monitored using the anti-eEF1γ rabbit polyclonal antibody. The levels of Tom20 protein were monitored using the anti-Tom20 polyclonal antibody. Anti-alpha-tubulin monoclonal antibody was used to normalise the amount of protein loaded on the gel. E: Representative florescence images of HeLa cells treated with either siRNA-Control or siRNA-eEF1γ (top). The cellular level of superoxide was visualized by the MitoSOX (red) mitochondrial Superoxide Indicator staining. Nuclei were stained with Hoechst (blue). Histogram reporting fold of increase of MitoSOX fluorescence of siRNA-eEF1γ treated cells (lane 2) versus siRNA-Control treated cells (lane 1), shown as means ± SD from three independent experiments (bottom).

