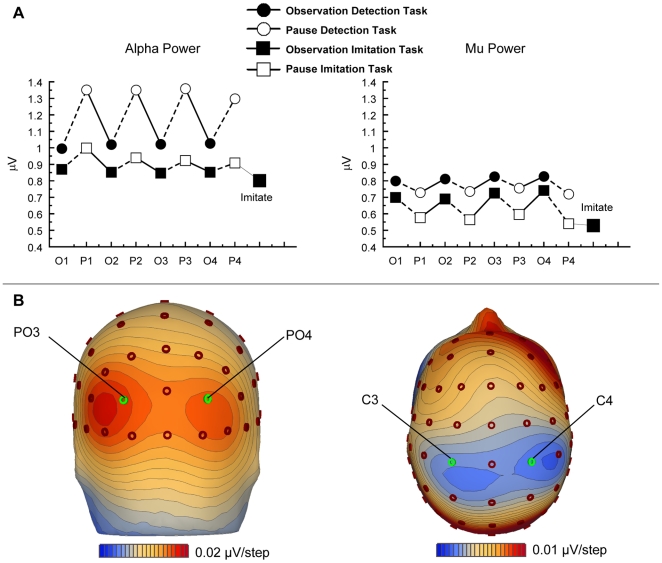
Figure 2. Effects on Alpha and Mu Power.
(A) Alpha power (left) and mu power (right) during observation (O1, O2, O3, O4; black symbols) and pause (P1, P2, P3, P4; white symbols) intervals in the imitation task (squares) and the detection task (circles). Squares labelled with “Imitate” represent power levels during execution of the observed movement sequence. (B) Topographic representation of alpha power (left) maximal at bilateral parieto-occipital electrode sites, and mu power (right) overlying the left and right rolandic fissure. Alpha and mu topographies reflect the difference between pause and observation intervals in the detection task and the imitation task, respectively.

