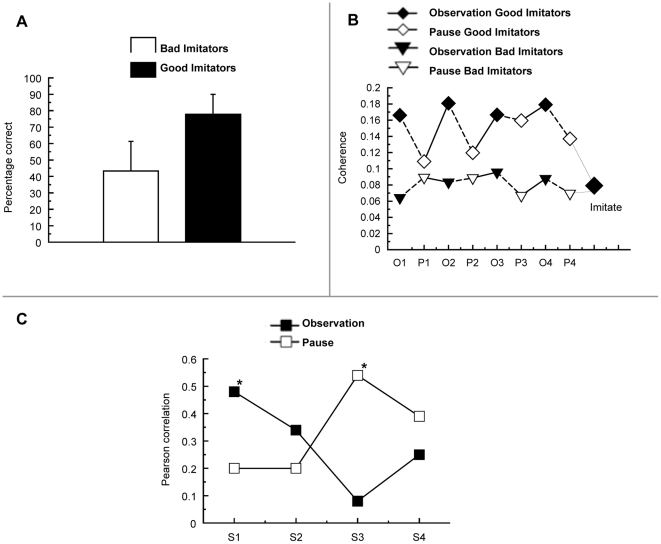
Figure 5. Interaction between Fronto-Parietal Coherence and Imitation Accuracy.
(A) Median split between individuals with high accuracy (good imitators) and low accuracy (bad imitators). Values reflect the percentage of correctly imitated movement sequences. Error bars reflect the Standard Errors of Means. (B) Fronto-parietal coherence for good imitators (diamonds) and bad imitators (triangles) over time. Good imitators show stronger fronto-parietal coherence as compared to bad imitators. Squares labelled with “Imitate” represent coherence of bad and good imitators during execution of the observed movement sequence. (C) Pearson correlations between fronto-parietal coherence per sequence repetition (S1, S2, S3, S4) and interval (observation, pause) and imitation accuracy. The difference in performance between good and bad imitators is predicted by fronto-parietal coherence during the first sequence observation and the third pause interval for repetition. Significant correlations (p<.05) labelled with *.

