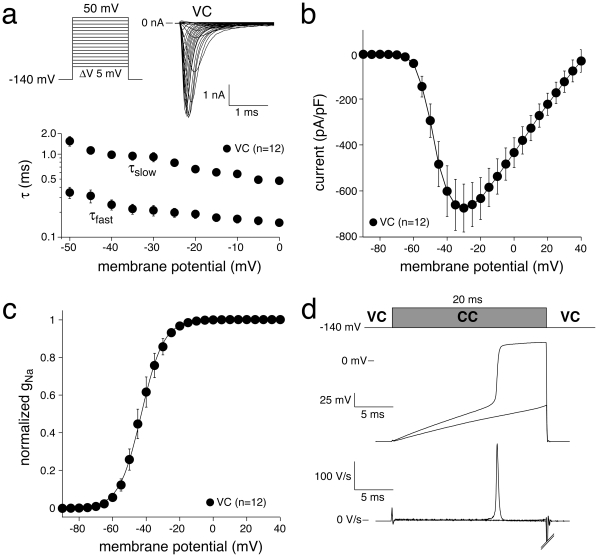
Figure 1. Activation of INa in HEK cells assessed with square-step voltage protocols in conventional VC experiments.
a, Top: Typical examples of Na+ current in response to depolarizing voltage steps from −140 mV. Bottom: Average fast and slow time constants of Na+ current inactivation. Note logarithmic ordinate scale. b, Average current-voltage relationship. c, Average steady-state activation. The solid line is the Boltzmann fit to the average data. d, Typical membrane depolarizations in response to a super- and subthreshold current pulse in a HEK cell during an alternating VC/CC experiment from a holding potential of −140 mV (top) and the first derivatives of the resulting membrane potential changes (dV/dt; bottom).

