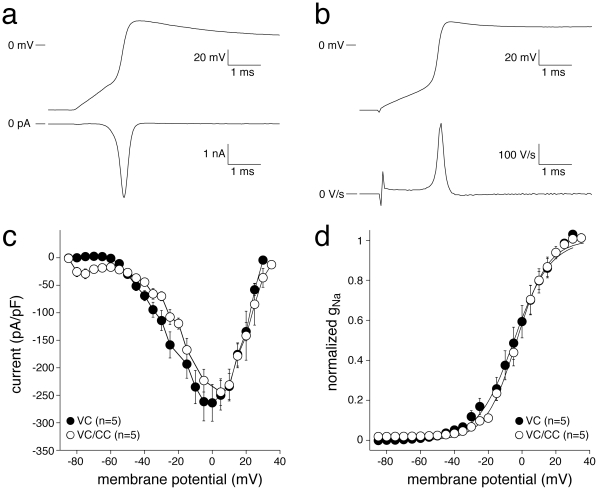
Figure 2. ‘Dynamic’ INa activation in HEK cells assessed with VC (a) and alternating VC/CC (b).
a, Typical example of Na+ current (bottom) during the upstroke phase of the ventricular action potential like waveform used as command potential in an action potential clamp experiment (top). b, Typical membrane depolarization from −85 mV (top) in response to a superthreshold current pulse and dV/dt (bottom). c, Average phase plane plots with current or dV/dt plotted against membrane potential. Note the similarity between the currrent densities of the VC and alternating VC/CC experiments. d, Average dynamic INa activation. Solid lines represent the Boltzmann fits to the average data.

