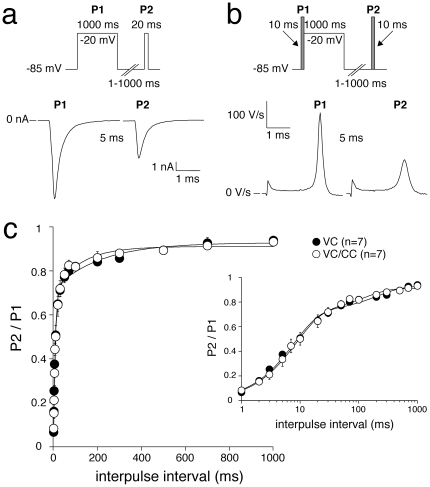
Figure 4. Recovery from INa inactivation in HEK cells assessed with VC (a) and alternating VC/CC (b).
a and b, Top: voltage clamp (a) and VC/CC (b) protocols with an interpulse interval of 1–1000 ms, as indicated. Bottom: typical examples of recovery from inactivation with an interpulse interval of 5 ms. c, Average recovery from inactivation. Inset, Average recovery from inactivation on a logarithmic time scale. Solid lines are double-exponential fits to the average data.

