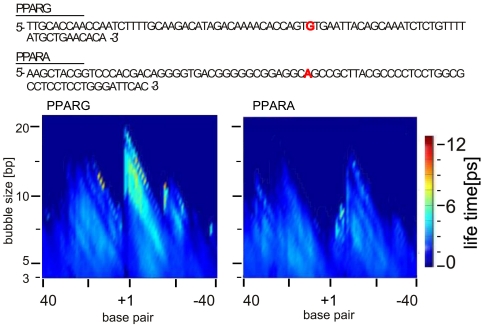
Figure 3. Computer simulation data.
EPBD based Langevin molecular dynamics showing the intrinsic breathing dynamics in the promoter regions of PPARG and PPARA genes: vertical axis - size of bubbles [base pairs, bp] with defined average lifetimes; horizontal axis - nucleotide position [base pair] where the TSS is labeled ‘+1’. The color bar on the right indicates the bubble lifetimes in pico seconds [ps]. The promoter sequences obtained from the DBTSS (http://dbtss.hgc.jp), are shown above the simulation data panel. The red letter indicates the TSS position. The identity of the gene sequence is shown above the plots.

