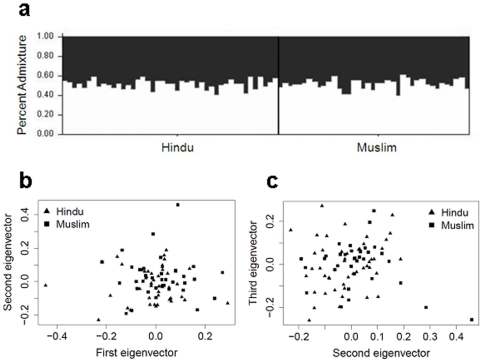
Figure 2. Estimates of population substructure using a subset of unrelated individuals from the primary scan families.
(a) Analysis using STRUCTURE for the admixture model assuming correlated frequencies and K = 2 subpopulations. Each individual is represented by a single vertical line, with each black or white segment corresponding to the proportion of the individual assigned to each of the K = 2 pre-defined subpopulations. Plots of (b) the first and second, and (c) the second and third, principal components analyzed using SMARTPCA. The reported religion for each unrelated individual is shown.

