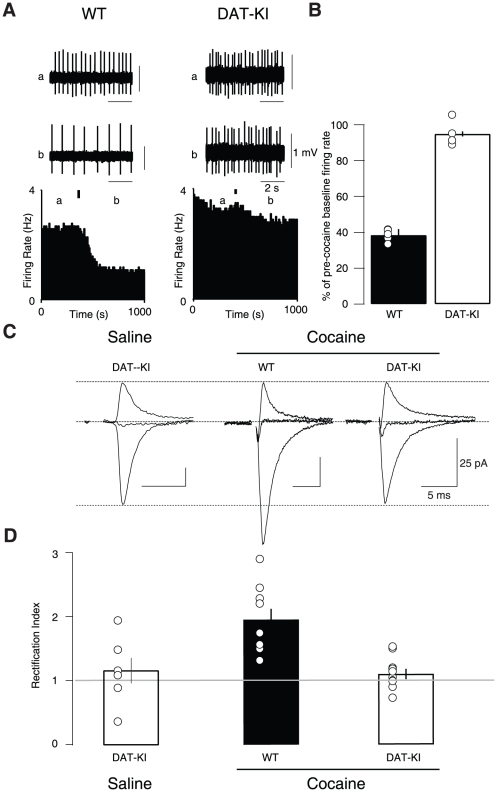
Figure 1. Cocaine drives the insertion of GluA2-lacking AMPARs via its effect on the DAT.
(A) Single unit extracellular in vivo recordings (above) and corresponding firing rate plots (below) of VTA neurons during a single i.p. injection of 15 mg/kg cocaine in either WT (left) or DATKI (right) mice. Black bar denotes injection time, (a) and (b) denote points from which example traces were taken. (B) The resulting inhibition of neuron firing rate observed in WT mice (38±3.3%) was not present in DATKI mice (94.9±1.4%). n = 4–5, t(7) = 16.5, p<0.0001. (C) Representative AMPAR excitatory postsynaptic currents recorded at −60, 0 and +30 mV (normalized to +40 mV AMPAR component) and RIs (D) of WT and DATKI mice 24 h post cocaine injection. Linearity corresponds to and RI of 1. Mean RI = 1.95±0.17 in WT, and 1.12±0.08 in DATKI; F(2–22) = 9.8, p<0.001, n = 5–9). All data are expressed as mean ± sem.

