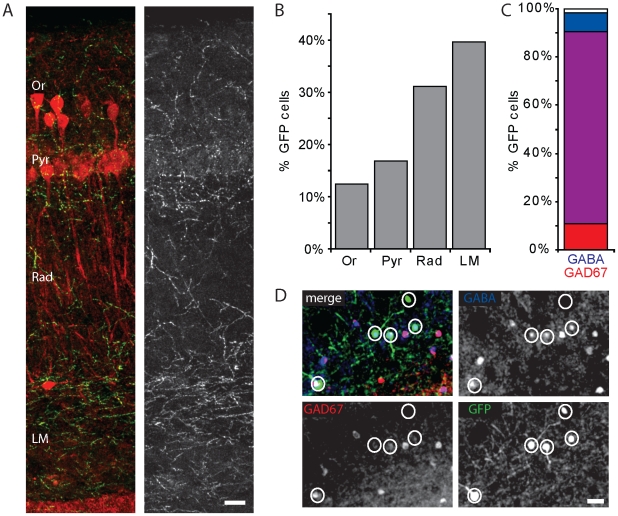
Figure 1. GFP-positive GABAergic interneurons.
A: Maximal projection image illustrating the distribution of GFP-labeled profiles in the CA1 layers. Calbindin (red), labeling a fraction of pyramidal cells, is only shown to facilitate recognition of the layers. B: Distribution of GFP-labeled interneurons in the hippocampal CA1 area in GAD65-GFP mice. C: Percentage of GFP-labeled cells that expressed GABA (blue), GAD67 (red) or both (purple). Data from 268 GFP cells; 10 sections. D: Example of triple immunostaining for GFP (green), GABA (blue) and GAD67 (red). Scale bars are 30 µm. Abbreviations of CA1 layers: Or - oriens; Pyr – pyramidale; Rad – radiatum; LM – lacunosum moleculare.

