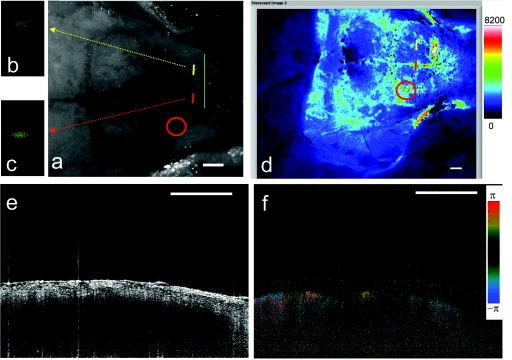
Figure 4.
(a) Reflectance image and (d) laser speckle flow index map of an intact mouse skull before PDT, with the irradiated target region highlighted by a red circle. Repeated SDOCTI scans are taken at the positions labeled by red and yellow bars, respectively. (b) and (c) DOCT images of the two vessels and (e) and (f) typical OCT and DOCT images at the cross-sectional position labeled with a green line in (a), respectively. (All scale bars represent 1 mm.)

