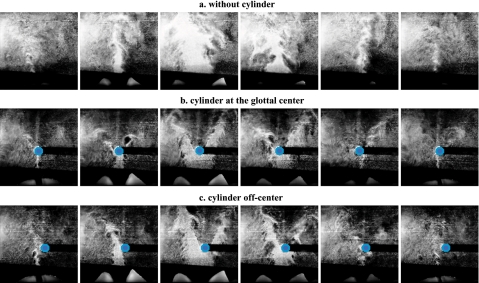
Figure 2.
(Color online) Typical images of the supraglottal flow field in the left–right and axial plane during one oscillation cycle: (a) Without cylinder; (b) cylinder was about at the glottal center (x = 4.5 mm, y = 0 mm); and (c) cylinder was on the right of the glottal center (x = 4.5 mm, y = 1.5 mm). The cylinder was highlighted by a hexagon. The black horizontal strip to the left of the hexagon is the shadow of the cylinder as the laser light sheet came from the left side.

