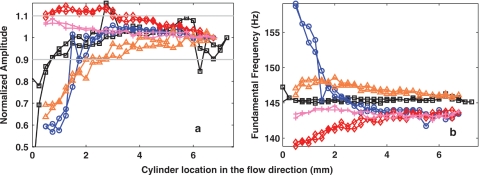
Figure 3.
(Color online) The normalized outside acoustic pressure amplitude (top) and fundamental frequency (bottom) as the cylinder was traversed in the flow direction for five cylinder locations in the left–right direction, ○: cylinder at y = −2 mm (location 1); ◇: cylinder at y = −1.4 mm (location 2); □: cylinder at y = 0 mm (glottal center, location 3); ▵: cylinder at y = 1.2 mm (location 4); and +: cylinder at y = 2.2 mm (location 5). The two straight lines in Fig. 3a indicate the borderlines of ±10% change in sound pressure amplitude.

