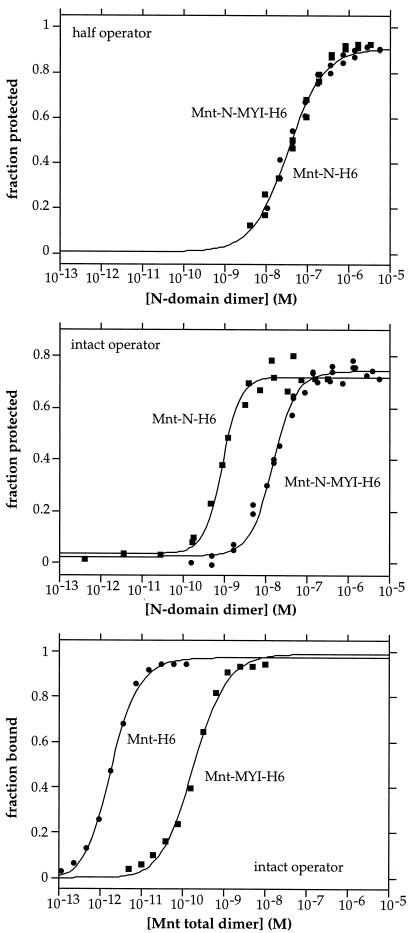
Figure 3.
DNA-binding assays. Top and Middle show binding of N-domain homodimers of Mnt-N-H6 and Mnt-N-MYI-H6 to a half operator site (Top) and to the full length mnt operator (Middle), as assayed by DNase I footprinting. Bottom shows binding of the tetrameric Mnt-H6 and Mnt-MYI-H6 proteins to the intact mnt operator as determined by gel mobility-shift assays. The solid lines in Top, Middle, and Bottom are theoretical fits of the experimental data calculated as described in Materials and Methods.

