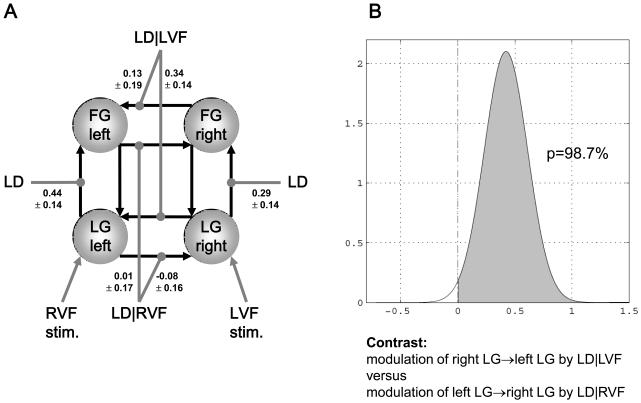
Figure 3.
This figure was adapted, with permission, from Figures 5 and 6 in [36]. It shows an example of a single subject DCM that was used to study asymmetries in interhemispheric connections during a letter decision task. LG = lingual gyrus, FG = fusiform gyrus, LD = letter decisions, LD|VF = letter decisions conditional on the visual field of stimulus presentation.
A. The values denote the maximum a posteriori (MAP) estimates of the parameters (± square root of the posterior variances; units: 1/s=Hz). For clarity, only the parameters of interest, i.e. the modulatory parameters of inter- and intra-hemispheric connections, are shown.
B. Asymmetry of callosal connections with regard to contextual modulation. The plots show the probability (98.7%) that the modulation of the right LG → left LG connection is stronger than the modulation of the left LG → right LG connection.

