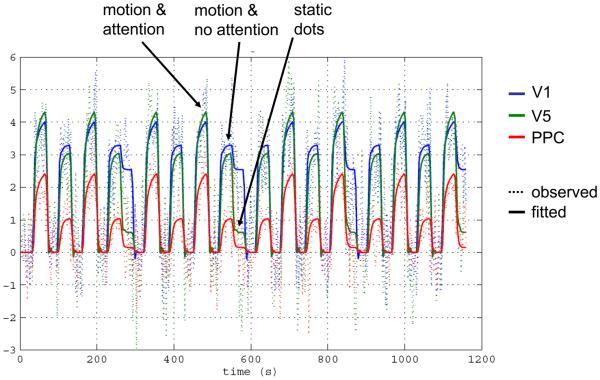
Figure 6.
Fit of the nonlinear model to the attention to motion data in Figure 5. Dotted lines represent the observed data, solid lines the responses predicted by the nonlinear DCM. The increase in the gain of V5 responses to V1 inputs during attention is clearly visible. The figure is reproduced, with permission, from Figure 8 in [30].

