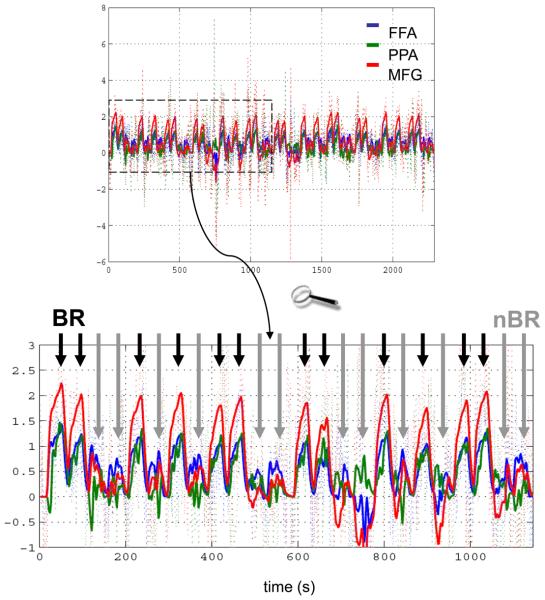
Figure 8.
Fit of the nonlinear model in Figure 7 to the binocular rivalry data. Dotted lines represent the observed data, solid lines the responses predicted by the nonlinear DCM. The upper panel shows the entire time series. The lower panel zooms in on the first half of the data (dotted box). One can see that the functional coupling between FFA (blue) and PPA (green) depends on the activity level in MFG (red): when MFG activity is high during binocular rivalry blocks (BR; short black arrows), FFA and PPA are strongly coupled and their responses are difficult to disambiguate. In contrast, when MFG activity is low, during non-rivalry blocks (nBR; long grey arrows), FFA and PPA are less coupled, and their activities evolve more independently. The figure is reproduced, with permission, from Figure 10 in [30].

