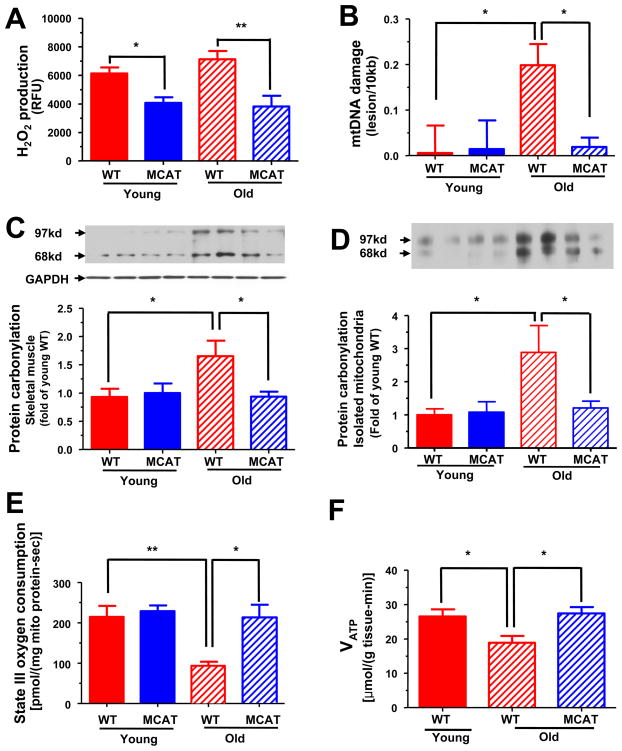
Figure 1.
Hydrogen peroxide production, mitochondrial damage and mitochondrial function (both in vitro and in vivo) in skeletal muscle of young and old WT and MCAT mice. (A) Maximal H2O2 emission of mitochondria derived from skeletal muscle (n=10–15 per group). (B) Mitochondrial DNA damage in skeletal muscle (n=4–6 per group). (C) Oxidative protein carbonylation in skeletal muscle extracts (n=6 per group) and (D) in skeletal muscle mitochondria (n=6 per group). (E) State III oxygen consumption of mitochondria derived from skeletal muscle (n=6 per group). (F) Basal rates of ATP synthesis in skeletal muscle assessed by in vivo 31P MRS (n=6 per group). All data are mean ± SEM. Asterisk (*) indicates P<0.05 and **P<0.01 by ANOVA with post-hoc analysis.

