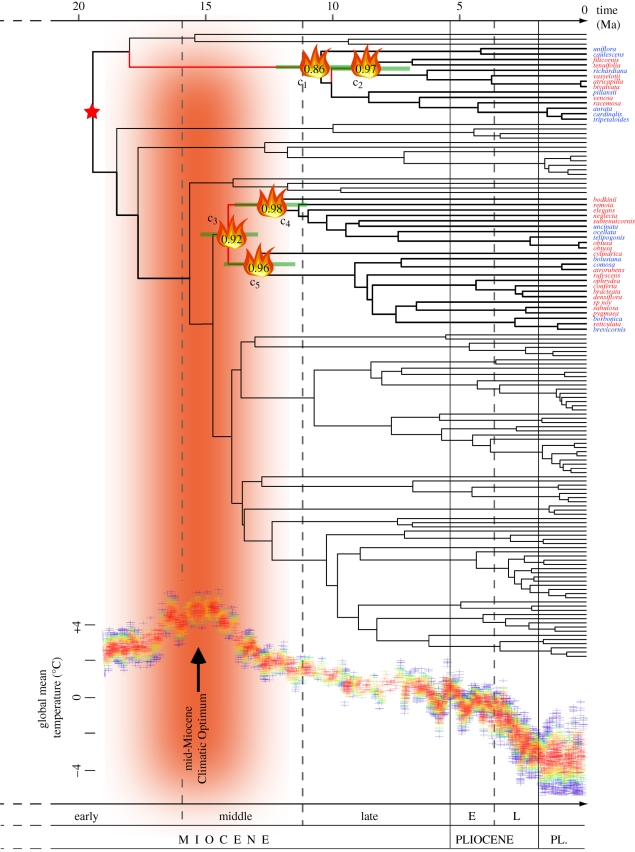
Figure 2.
Temporal evolution of Disa and earliest optimizations of fire. Maximum a posteriori tree from the Bayesian analysis of 136 taxa, with branch lengths proportional to mean ages estimated from a sample of 1000 independently dated chronograms using penalized likelihood. The oldest shifts to fire habitats are outlined by the fire symbol (with relative average likelihood values inside), and the corresponding branches along which shifts occurred highlighted in red. Species marked in red are obligate fire-dependent. Green bars indicate 95% confidence intervals of critical nodes (clades C1–C5; see table 1 for precise values). The red star indicates the calibration point. Temperature curve from Zachos et al. [45]; timescale from Gradstein & Ogg [77].

