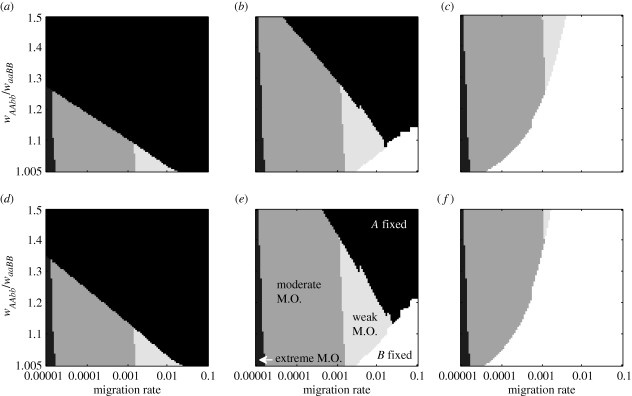
Figure 3.
Outcomes of simulations from the epistasis model as influenced by migration rate, the ratio (wAAbb/waaBB) of fitnesses of the two favoured alleles, and the fitness wAABB (=wAaBB = wAABb = wAaBb) of genotypes having at least one copy of each of the two incompatible alleles. Each panel represents outcomes from 10 000 simulations for varying combinations of the fitness ratio (wAAbb/waaBB) and the migration rate. In all panels, there is no allopatric divergence period (i.e. tcontact = 0). Outcome classifications are according to the shading as detailed in (e) and as explained in the text. (a) no lag, wAABB = 0.9; (b) qthresh = 0.01, wAABB = 0.9; (c) qthresh = 0.333, wAABB = 0.9; (d) no lag, wAABB = 0.001; (e) qthresh = 0.01, wAABB = 0.001; (f) qthresh = 0.333, wAABB = 0.001.

