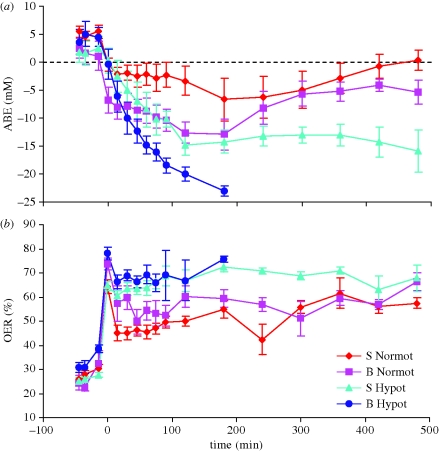
Figure 2.
(a) Arterial actual base excess (ABE) and (b) oxygen extraction ratio (OER) in four groups of animals (for details see legend to figure 1). Time indicates time from the onset of resuscitation. First three values represent baseline 1, baseline 3 and blast (or sham blast). Mean values ± s.e.m.

