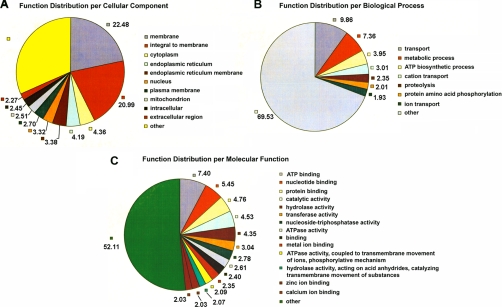
Fig. 7.
Pie charts of functional distribution per cellular component (A), biological processes (B) and (C) molecular function from the membrane proteins identified by all three proteomic strategies (Fig. 1). Numbers represent the percentage from the total of identified membrane proteins. Proteins are listed in Supplementary Tables.

