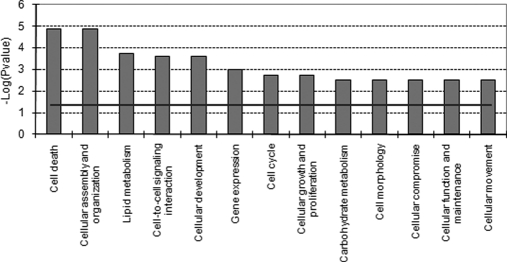
Fig. 6.
Molecular and cellular functional classes affected in second approach to detect genistein-induced ERβ-mediated effects on protein expression (sample ED; Table II). IPA molecular and cellular functions of the H/L proteins with a p value <0.001 are shown. The selected scoring method was based on Fisher's exact test p value. The high level functional categories that are involved in this analysis are displayed along the x axis in decreasing order of significance. The y axis displays the −(log) significance. The horizontal line denotes the cutoff for significance (p value of 0.05).

