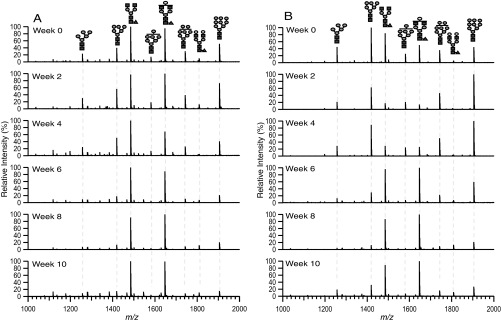
Fig. 3.
Representative MALDI FT-ICR mass spectra of A, mock surgery control and B, tumor-transplanted mouse sera at different time points. m/z 1000–2000 region of 10% acetonitrile fraction taken in the positive ion mode is shown. See Fig. 1 for glycan symbols.

