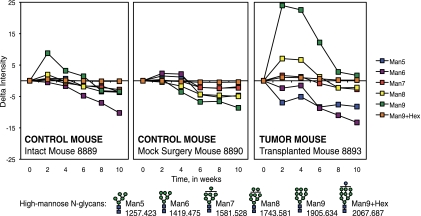
Fig. 4.
Change in intensities from MALDI FT-ICR MS of high-mannose N-linked glycans in sera of an intact control mouse, mock surgery control mouse, and a tumor-transplanted mouse during breast cancer progression. All values relative to Week 0 intensity. Error bars are expressed as standard error of the mean (S.E.) from three spectral scans per mouse sample. Symbol representations of glycans (39): N-acetylglucosamine, blue square; mannose, green circle; glucose, blue circle.

