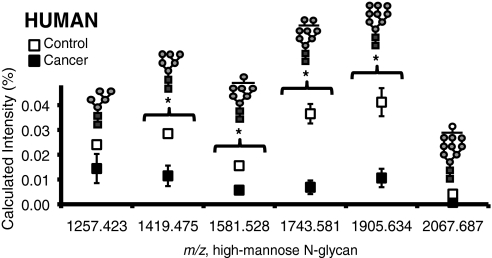
Fig. 6.
High-mannose glycans in human sera of control (n = 5) and cancer (n = 7) groups. Glycans marked with * have p value < 0.05. Glycans were analyzed using the internal standard method by MALDI FT-ICR MS. Error bars are expressed as S.E. See Fig. 1 for glycan symbols.

