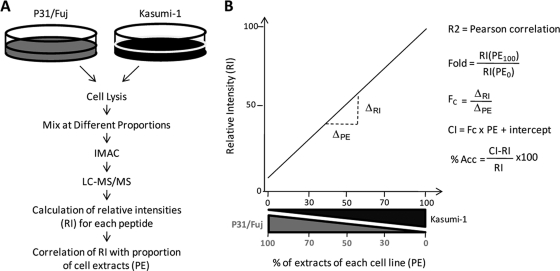
Fig. 1.
Scheme for simultaneous calculation of fold changes, linearity, and accuracy in high-content phosphoproteomics experiments. A, Samples to be compared (in this illustrative example P31/Fuj and Kasumi-1 AML cell lines) are lysed and the cell lysates mixed at different proportions. Following digestion and immobilized metal ion affinity chromatography enrichment, phosphopeptides are identified and quantified by LC-MS/MS and the relative intensity of each phosphopeptide (RI) correlated with the proportion of each cell extract in the mixture (PE). B, Analysis of correlated data allows calculating linearity (correlation coefficient, R2), fold of change (Fold), fold coefficient (Fc) and accuracy (%Acc).

