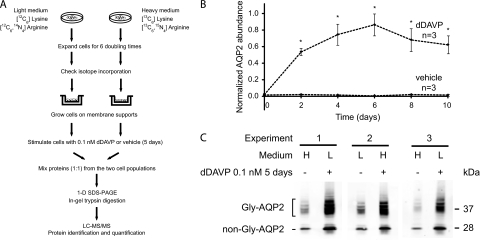
Fig. 1.
Quantitative SILAC LC-MS/MS protein mass spectrometry. A, A flowchart of protocol for SILAC and LC-MS/MS. B, Time course of changes in aquaporin-2 (AQP2) protein abundance in mpkCCD cells in response to dDAVP. The mpkCCD cells were grown on membrane supports until confluence before they were exposed to 0.1 nm dDAVP or vehicle starting on day zero. Twenty μg protein samples collected at different time points were used for semiquantitative immunoblotting with an aquaporin-2 antibody. Values are mean ±S.E. Asterisks denote significant differences in aquaporin-2 abundances between dDAVP- and vehicle exposed cells for the same day (p < 0.01). Individual immunoblots are shown in the Supplemental Fig. S2. C, Steady-state aquaporin-2 protein abundance in mpkCCD cells used for LC-MS/MS quantification. The mpkCCD cells labeled with either heavy (H) or light (L) amino acids were grown on permeable supports until confluence before exposure to either 0.1 nm dDAVP or vehicle for 5 days. Proteins were extracted and used for immunoblotting with an aquaporin-2 antibody that detects both glycosylated (Gly-AQP2) and nonglycosylated aquaporin-2 (non-Gly-AQP2). 20 μg protein were loaded in each lane.

