Fig. 2.
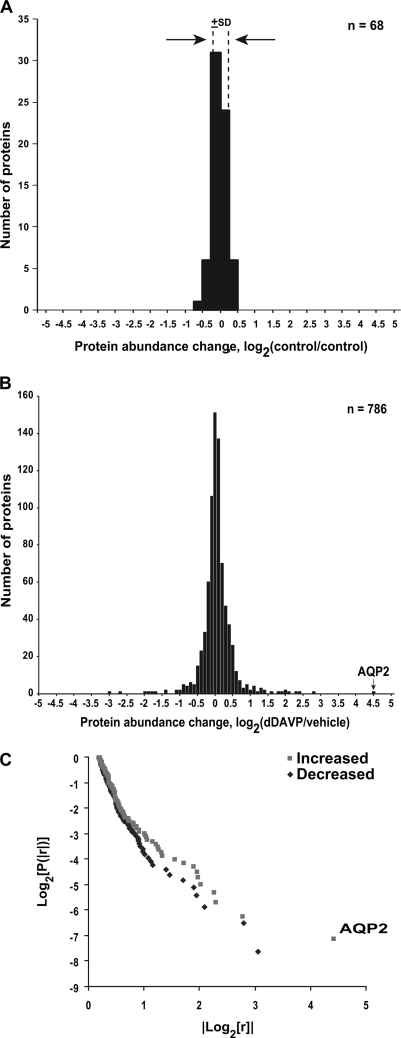
SILAC LC-MS/MS protein quantification. A, Variability of SILAC method. Distribution of protein abundance ratios for nominally identically treated cells (control versus control) except for labeling with SILAC light (L) and heavy (H) amino acids. The standard deviation of log2(L/H) values was ± 0.18 (dashed lines). Bin size = 0.25. B, Distribution of protein log2(D/C) values among all proteins quantified, where D is signal obtained in presence of dDAVP (5 day) and C is signal obtained in presence of vehicle. The value corresponding to aquaporin-2 (AQP2) abundance change is indicated. Bin size = 0.1. C, Log-log plot of cumulative probability versus absolute value of ratio for all mean values from Supplemental Table S4 in which log2(D/C) is greater than or equal to 0.2, showing “long-tailed distribution.” AQP2 change is labeled.

