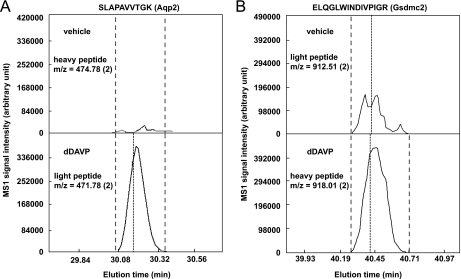
Fig. 3.
Typical reconstructed SILAC LC-MS/MS chromatograms for A, aquaporin-2 and B, gasdermin C2 peptides. Examples of corresponding heavy- and light-labeled aquaporin-2 (Aqp2, NP_033829) and gasdermin C2 (Gsdmc2, NP_808580) peptides are shown. Quantification was carried out using the trapezoidal rule for numerical integration (QUIL program, see Experimental Procedures). Dashed lines define the range within which the peptide intensity was integrated. Dotted lines indicate the time point when a peptide sequence was identified. The m/z (charge) of the peptides are indicated. Similar results were obtained for all three sample pairs, despite alternating heavy and light labeling.

