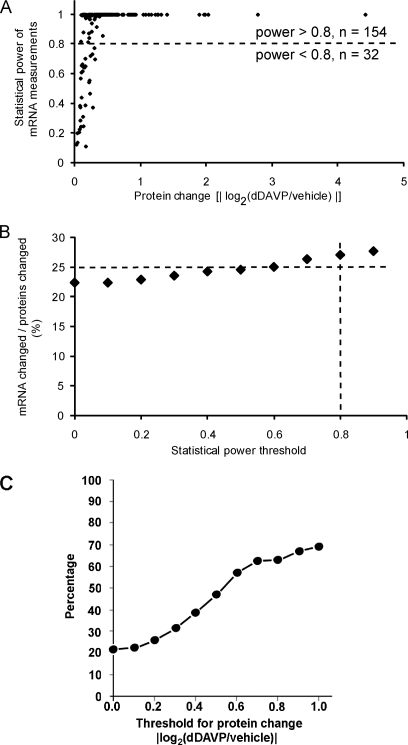
Fig. 7.
Comparison of protein changes with transcript changes. A, Statistical power coefficients (vertical axis) obtained when testing for mRNA abundance differences that are percentage-wise equivalent to the measured protein abundance changes (horizontal axis) for the same gene. Data shown include only proteins whose abundances were significantly altered in response to dDAVP as quantified by SILAC LC-MS/MS. B, Percent of the regulated proteins that show corresponding changes in transcript abundances as a function of statistical power threshold. For example, 27% of the regulated proteins have significant changes in the corresponding mRNAs when limited to comparisons with statistical power greater than 0.8. C, Percent of regulated proteins that show corresponding changes in transcript abundance as a function of magnitude of protein abundance change threshold.

