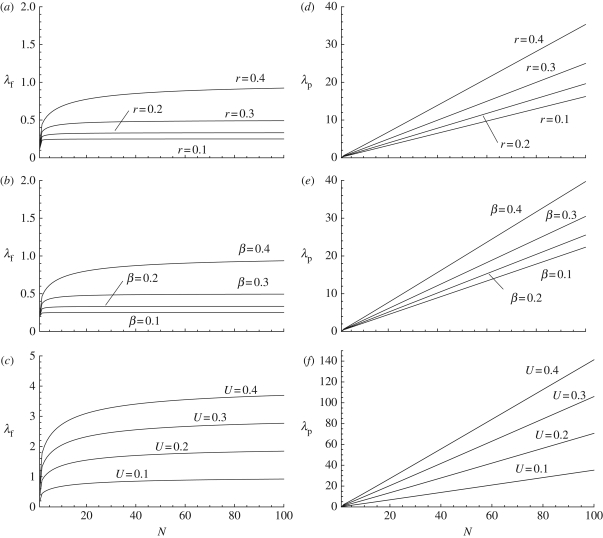
Figure 1.
(a–c): mean number λf of cultural traits per individual graphed as a function of population size N for various parameter values. In (a), the innovation and the transmission rates are held constant (U = 0.1 and β = 0.5), while the recall rate, r, varies; from the top to the bottom curves, r = 0.4, 0.3, 0.2 and 0.1. In (b), the innovation and recall rates are held constant (U = 0.1 and r = 0.5), while the transmission rate β varies; from the top to the bottom curves β = 0.4, 0.3, 0.2 and 0.1. In (c), the transmission and memory rates are held constant (β = 0.1, and r = 0.5), while the innovation rate U varies; from the top to the bottom curves U = 0.4, 0.3, 0.2 and 0.1. (d–f): mean population number of cultural traits λp graphed as a function of population size N for exactly the same combinations of parameter values as given in (a–c).

