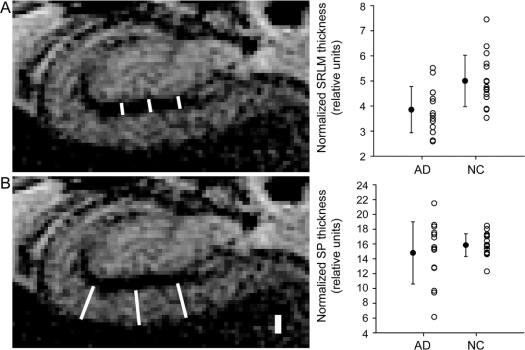
Figure 3 Hippocampal subfield metrics
The thickness of the CA1 stratum radiatum/stratum lacunosum-moleculare (SLRM) (A) and the thickness of the CA1 stratum pyramidale (SP) (B) were measured for each individual. At left are examples of how measurements were performed (see Methods), drawn on the right hippocampus of a normal control (NC). The scale bar is 1 mm. Normalized data (see table 2) are summarized in the graphs, with error bars representing the SD. AD = Alzheimer disease.

